
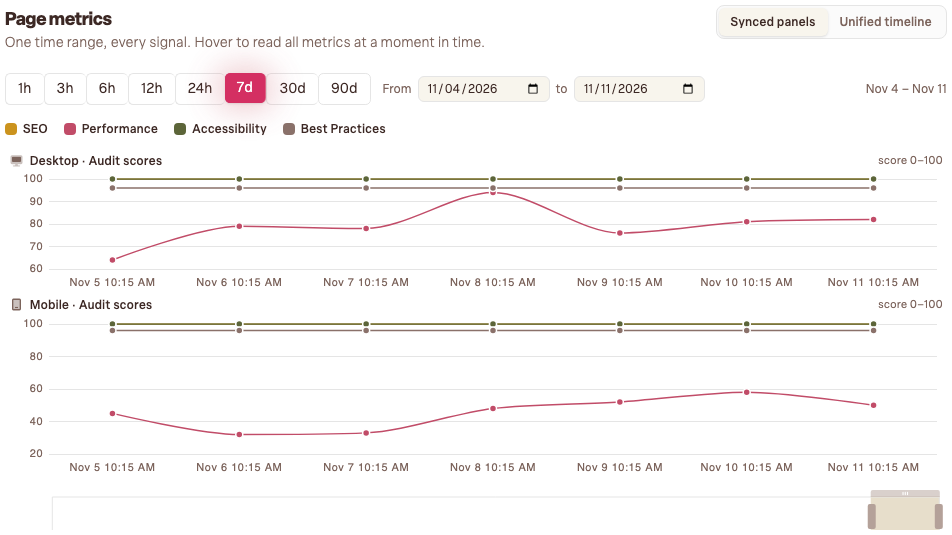
Single scores tell you where you are; the page metrics graph tells you where you're headed. It plots every audit result over time, which makes it the best tool in Bloomlight for answering "did that change help?"
Reading the graph
Open any key page and you'll find its metrics timeline: scores across your chosen window, alongside uptime on your home page. Two shapes matter. A step (a sudden jump or drop) means something changed on a specific day: a deploy, a new plugin, a big image someone uploaded. A drift (a slow slope) means gradual accumulation, like a media library growing heavier month by month.
When something dropped
Note the date the step happened and bring it to whoever touches the site. "Performance fell nine points on the 14th, what shipped that day?" is a question that gets fixed, because it points at a specific day and a specific page.
When something's improving
Gradual wins are easy to miss and worth celebrating. If you've been clearing findings for a month, the graph is the receipt: a steady climb you can screenshot into a team chat. Progress that's visible tends to continue.
Make it a habit
You don't need to watch daily; the weekly report will flag score movement for you. But after every intentional change (a fix, a redesign, a new page), check the graph a few days later. Cause, effect, confirmed.